
Let’s say you ask your AI chatbot a question. If it doesn’t know the answer, it might make something up—or “hallucinate,” a term techies have been using since the 1970s.
How did your chatbot arrive at that answer? It’s hard to say. AI’s deep learning systems don’t show their work. Instead, most AI models are a kind of black box. They mysteriously process inputs and mysteriously turn them into outputs.
Educational content shouldn’t be that way. Nor should its authors “hallucinate.” At CFR Education, we make sure the information and answers we provide are informative, accessible, and, above all, accurate. And because there’s no black box here, we’d love to share how we arrive at those answers.
Where Our Writing Comes From
As an ace newspaper reporter will tell you: Your story is only as good as your sources. Like that reporter, we rely on quality sources to inform our writing. We use two main types of sources. The first is open-source materials like articles, journals, government and non-government reports, primary documents, and expert analysis. Our other source is the experts themselves; we go directly to CFR’s experts.
What does this look like in practice?
For a recent resource, “Regional Politics: The Americas,” we started with the experts. We jumped on the phone with one of our Latin-America experts who helped us generate a list of topics. These were the most relevant stories in the region—like Colombia’s ongoing fight against armed groups. We then began researching. We used news articles published by international media outlets (like the BBC and Associated Press) and local media outlets (like The City Paper Bogotá) to get both global and local perspectives. We also used think tank reports, human rights reports, and investigative analyses.
We can’t always assume that the facts found in open sources are accurate. (Even the best sometimes make uncited claims.) Because of this, we often rely on multiple sources. And as a final measure, we send our work to CFR experts for a final review before we publish.
That means our process begins and ends with CFR’s experts.
After we drafted “Regional Politics: The Americas,” we sent the draft back to the expert. We then worked with that expert to make sure every sentence was as accurate as possible. In one case, we needed to specify that armed fighters previously of the Revolutionary Armed Forces of Colombia (FARC) are now called “dissidents,” because the FARC has demobilized. When fact checking, every word matters.
Where Our Data and Visuals Come From
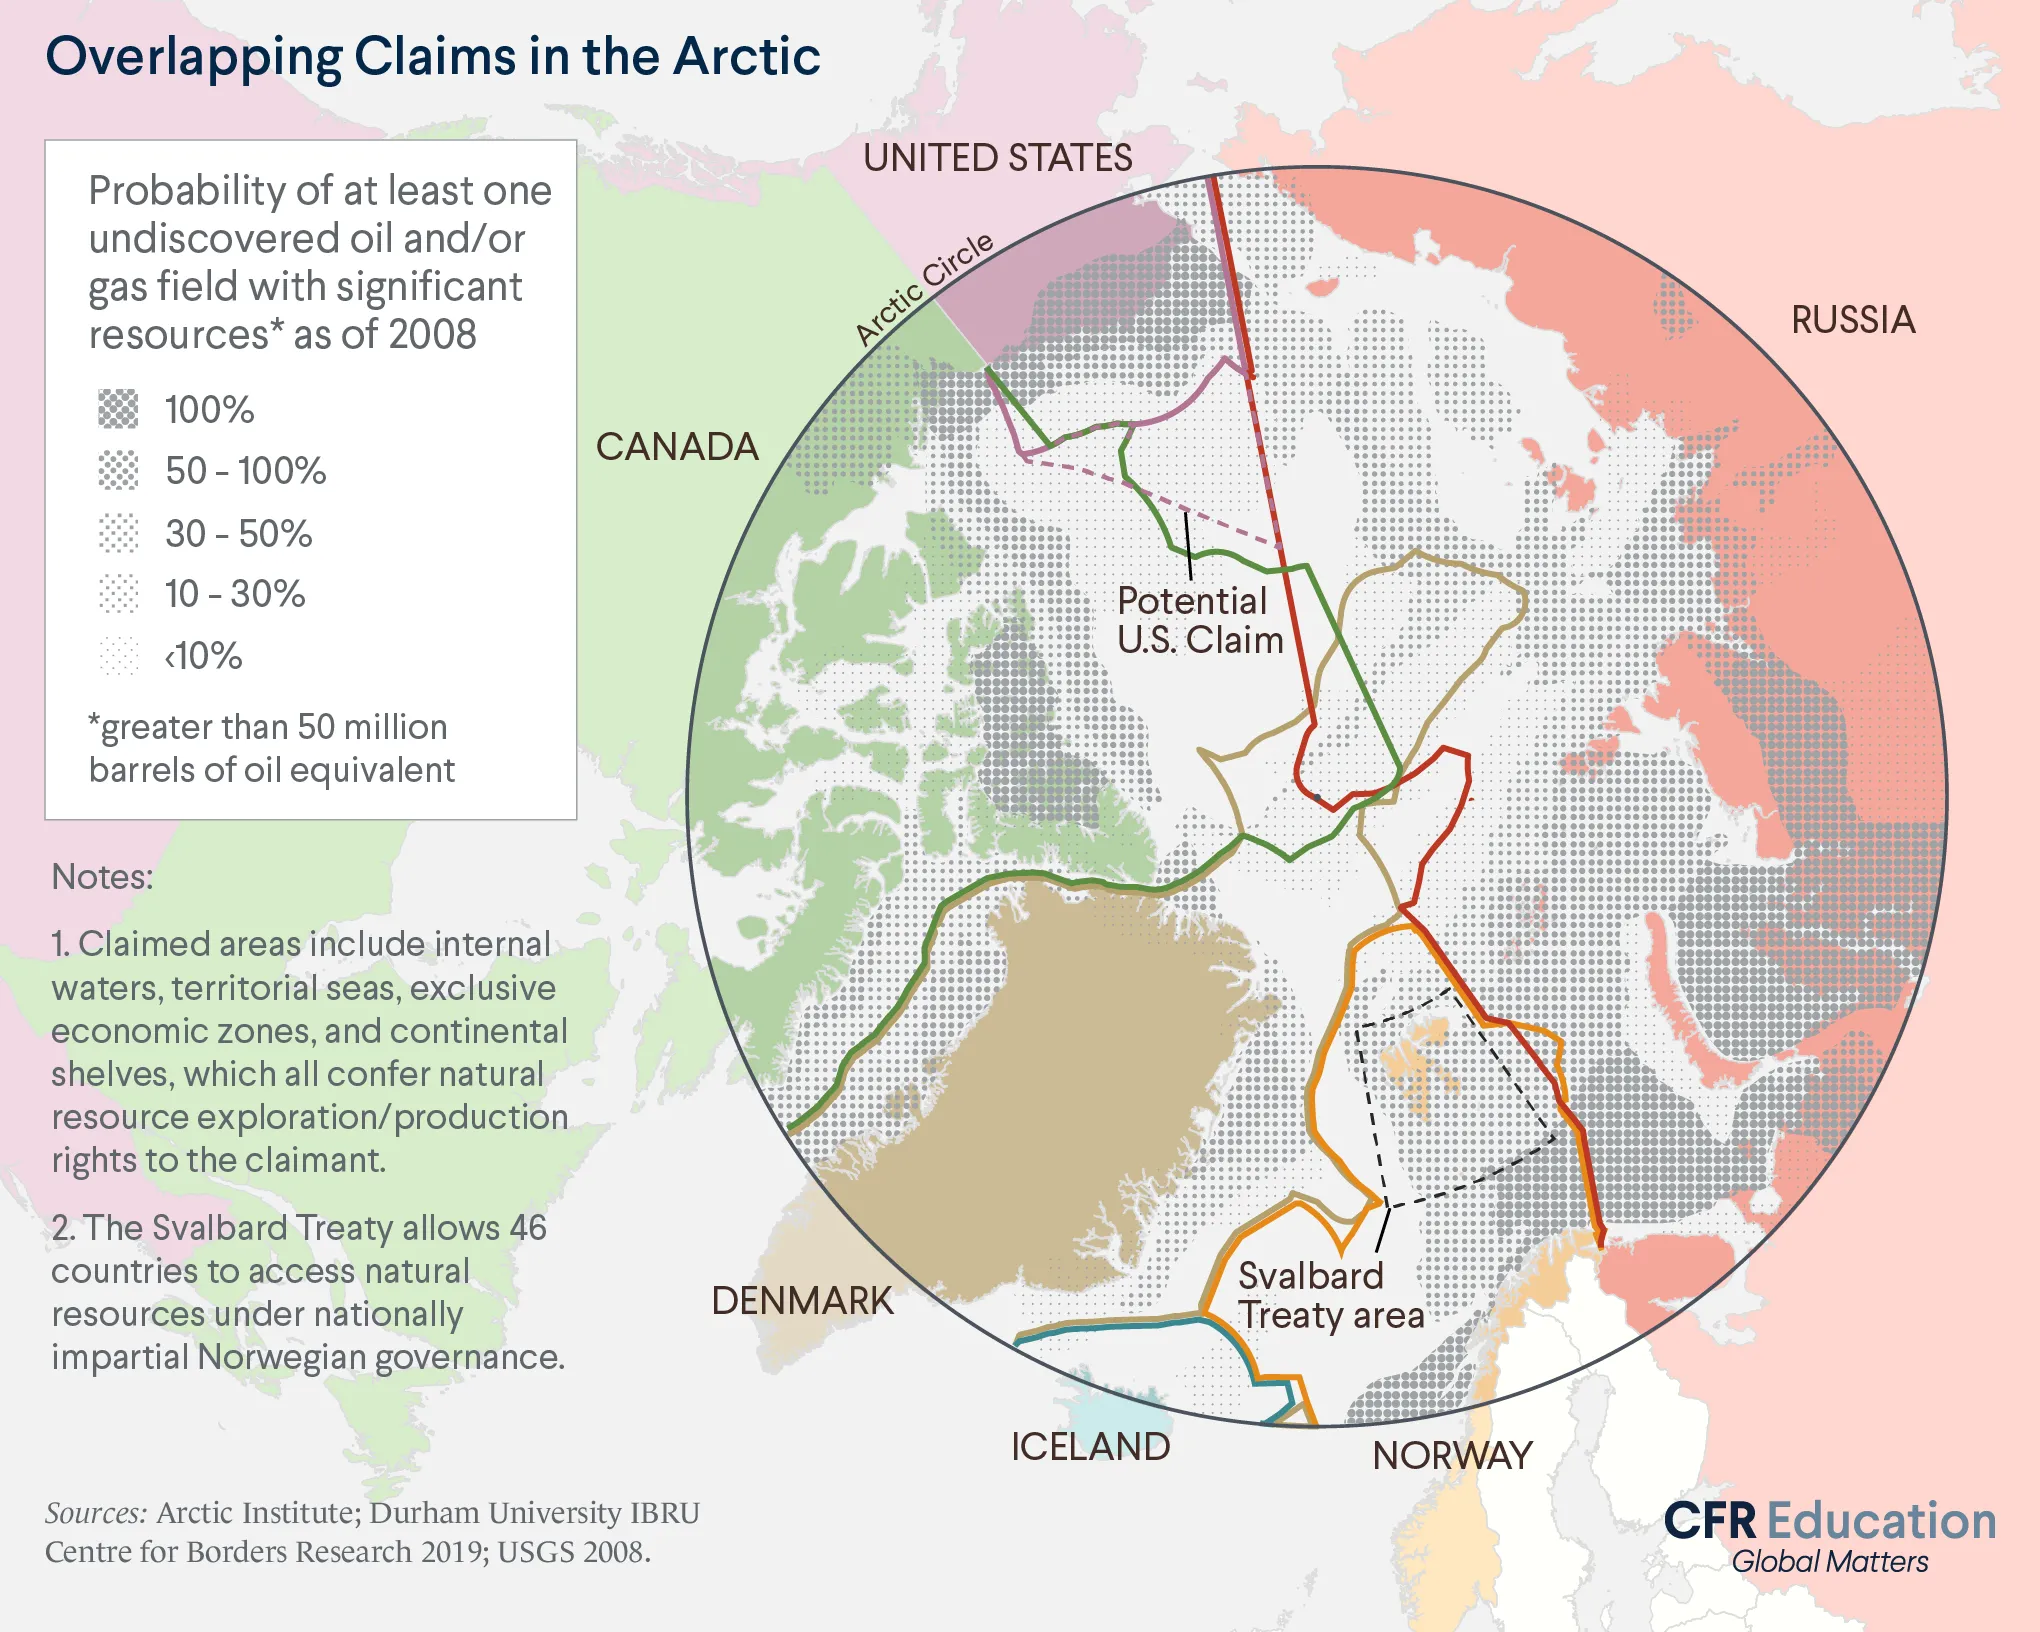
We strive to make complex ideas accessible, memorable, and impactful. That’s why we integrate visualization into our resources, because the right chart in the right place can reveal insights beyond text alone. Whether highlighting scale, illustrating trends over time, or visualizing nuanced concepts such as territorial disputes, our visual tools are designed to support learning and spark curiosity.
In general, we try to balance three considerations—the integrity of the data, its overall insight, and what we believe resonates with readers.
We start by asking: What kind of data helps tell this story? And is the information available and trustworthy? High-quality data is the foundation of our visualizations. We source information from recognized institutions, ranging from governments and UN agencies to academic bodies and research centers. From there, we consider which visual choices will deepen understanding without betraying nuance—would a map, bar chart, or line graph best support the idea?
For “Regional Politics: The Americas,” we used a mix of everything. To illustrate the rise of U.S.-Mexico border crossings, we chose an area chart because it makes long-term trends and spikes easier to spot at a glance. To illustrate the regional drug trade, we decided on a stacked bar chart because it helps us compare two trends: the total amount of coca bush grown each year and each country’s share of that total.
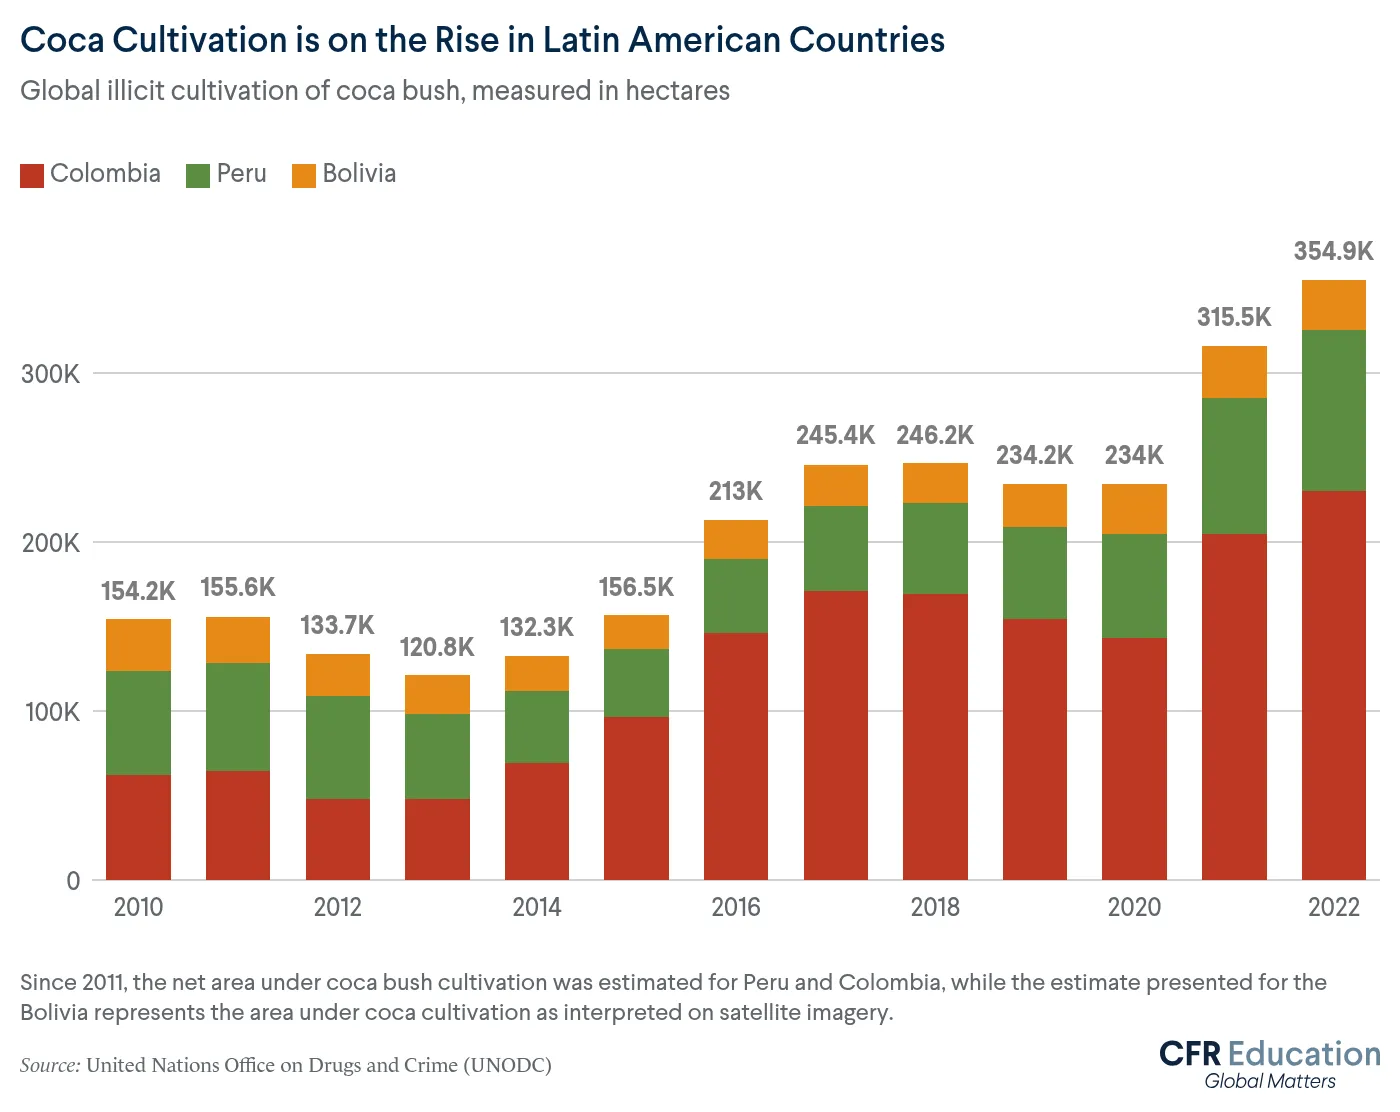
Combining multiple elements in a single visual is just one method we use to make complex geopolitical issues more straightforward to understand.
How We Update
What’s true about the world today may not be true tomorrow. For that reason, we continuously update the content on our site. At the top of each page, readers will notice a date signaling the last time we made an update. The most up-to-date data, however, isn’t always available when we update our text. For that reason, we include the original date for all data and visualizations to give readers the proper context. (Annual reports, for example, usually describe the year before they were published.)
We treat updates like any other editorial process. We use a variety of sources to inform our changes, review data in our infographics to ensure everything is up to date, and consult with CFR experts when updates turn into longer text additions.
A Final Word
Strong readers practice critical reading. That’s why we encourage our audience to ask questions, follow suggested links to additional information, and to continue the conversation with others in and outside the classroom.
We are committed to ensuring our resources are accurate and trustworthy. If you want to suggest a correction, please contact us at [email protected].